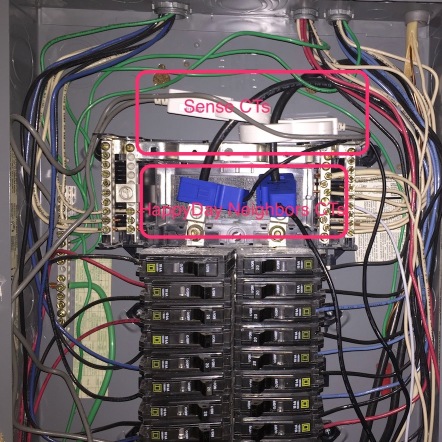
 Yippee!! I clamped the CTs on the incoming power cables:

Attached the CTs to the Energy Monitor:

Plug in the 9V AC Transformers:

Get the Raspberry Pi to collect the data and create a visualization:

I compared results to the readings I get from the Sense monitor. The Sense monitor’s readings are typically about 70 watts more. A 70 watt difference seems “good enough” for me.
As I mentioned in a previous post, I used Dash (plotly) to visualize. While the current visualization is ugly/course, it is a great start with very little code required. Just by using Dash/plotly, I’m able to zoom into sections of the plot and get the value of individual data points:

I zoomed into the area of the plot which monitored energy use while I was making coffee.
It is exciting – and a relief – to get to plotting power readings. There’s some stuff I need to do before I install into my neighbor’s breaker box…but this is a nice milestone.
